
 ,
Noukpo Medard Agbazo*,
Saa Moussa Kamano,
Mafory Bangoura,
Kande Bangoura
,
Noukpo Medard Agbazo*,
Saa Moussa Kamano,
Mafory Bangoura,
Kande Bangoura
Dissolved oxygen is an essential indicator of water pollution and the critical water quality constituent that impacts aquatic life. Thus, accurate modeling of its concentration is vital for freshwater resource management and protection. Despite this, in the African context, more specifically West Africa, there is virtually no scientific work that has focused on modeling dissolved oxygen concentrations in rivers and lakes. This preliminary work attempted to model and estimate, using others microbiological and physicochemical parameters and machine learning algorithms, the dissolved oxygen concentration of the Tighen River water in the Republic of Guinea. Based on two alternatives, three algorithms such as multiple linear regression (MLR), random forest (RF), and gradient boosting (GB) were employed to model and estimate dissolved oxygen concentrations. Alternative 1 referred to when microbiological and physicochemical parameters exhibiting correlations greater than + 0.1 or less than − 0.1 with dissolved oxygen are used for modeling its concentration, while alternative 2 referred to when variables exhibiting statistically significant correlations with dissolved oxygen are used. Results obtained from the models were evaluated using Nash-Sutcliffe efficiency coefficient (NSE), mean absolute error (MAE), Pearson correlation coefficient (RP), and root mean square error (RMSE) to identify the appropriate alternative and algorithm to model and estimate the dissolved oxygen. In the testing phase, the results showed that (1) among tested alternatives, alternative 2 quasi-systematically presents a smaller RMSE and MAE, and higher NSE and RP, indicating that it is significantly better than the alternative 1. (2) among the employed algorithms, under alternative 2, the RF algorithm exhibits the best performance in modeling dissolved oxygen, therefore, RF outperforms, MLR, and GB algorithm. These findings provide a scientific reference to enhance freshwater resource management and protection in Tighen river.
| Published in | American Journal of Applied Chemistry (Volume 14, Issue 3) |
| DOI | 10.11648/j.ajac.20261403.11 |
| Page(s) | 42-51 |
| Creative Commons |
This is an Open Access article, distributed under the terms of the Creative Commons Attribution 4.0 International License (http://creativecommons.org/licenses/by/4.0/), which permits unrestricted use, distribution and reproduction in any medium or format, provided the original work is properly cited. |
| Copyright |
Copyright © The Author(s), 2026. Published by Science Publishing Group |
Dissolved Oxygen, Modeling, Machine Learning, Water Quality, Applied Chemistry, Tighen River
MLR | Multiple Linear Regression |
RF | Random Forest |
GB | Gradient Boosting |
NSE | Nash-Sutcliffe Efficiency |
MAE | Mean Absolute Error |
RP | Pearson Correlation |
RMSE | Root Mean Square Error |
GA-XGCBXT | Genetic Algorithm (GA) with the High-performance Gradient Boosting |
DO | Dissolved Oxygen |
TDS | Total Dissolved Solid |
SatO2 | Oxygen Saturation |
NO3 | Nitrates |
NO2 | Nitrites |
PO4 | Phosphate |
K | Potassium |
Mn | Manganese |
| [1] | Schmid, B. H., and Koskiaho, J. (2006). Artificial neural network modeling of dissolved oxygen in a wetland pond: the case study Hovi, Finland. |
| [2] | Singh, K. P.; Basant, A.; Malik, A.; Jain, G. Artificial neural network modeling of the river water quality-A case study. Ecol. Model. 2009, 220, 888–895. |
| [3] | Rankovic, V., Radulovic, J., Radojevic, I., Ostojic, A., and Comic, A. (2010). Neural network modeling of dissolved oxygen in the Gruza reservoir, Serbia. Ecol. Model., 221, 1239-1244. |
| [4] | Ay, M., and Kisi, O. (2012). Modeling of dissolved oxygen concentration using different neural network techniques in Foundation Creek, El Paso County, Colorado, USA. J. Environ. Eng., 138(6), 654-662. |
| [5] | Li, Q.; He, J.; Mu, D.; Liu, H.; Li, S. Dissolved Oxygen Modeling by a Bayesian-optimized Explainable Artificial Intelligence Approach. Appl. Sci. 2025, 15, 1471. |
| [6] | Olyaie, E.; Abyaneh, H. Z.; Mehr, A. D. A comparative analysis among computational intelligence techniques for dissolved oxygen prediction in Delaware River. Geosci. Front. 2017, 8, 517–527. |
| [7] | Dodig, A.; Ricci, E.; Kvascev, G.; Stojkovic, M. A novel machine learning-based framework for the water quality parameters prediction using hybrid long short-term memory and locally weighted scatterplot smoothing methods. J. Hydroinform. 2024, 26, 1059–1079. |
| [8] | He, H.; Boehringer, T.; Schäfer, B.; Heppell, K.; Beck, C. Analyzing spatio-temporal dynamics of dissolved oxygen for the River Thames using superstatistical methods and machine learning. Sci. Rep. 2024, 14, 21288. |
| [9] | Macêdo, B. d. S.; Lima, L.; Fonseca, D. L.; Boratto, T. H. A.; Saporetti, C. M.; Fetoshi, O.; Hajrizi, E.; Bytyçi, P.; Aires, U. R. V.; Yonaba, R.; et al. Evolutionary-Assisted Data Driven Approach for Dissolved Oxygen Modeling: A Case Study in Kosovo. Earth2025, 6, 81. |
| [10] | Zhao, Y.; Chen, M. Prediction of river dissolved oxygen (DO) based on multi-source data and various machine learning coupling models. PLoS ONE 2025, 20, e0319256. |
| [11] | Kisi, O., Ozkan, C., and Akay, B. (2012). Modeling Discharge-Sediment Relationship Using Neural Networks with Artificial Bee colony Algorithm. J. Hydrol. 428-429, 94–103. |
| [12] | Chen, W.-B.; Liu, W.-C. Artificial neural network modeling of dissolved oxygen in reservoir. Environ. Monit. Assess. 2014, 186, 1203–1217. |
| [13] | He, Z., Wen, X., Liu, H., and Du, J. (2014). A Comparative Study of Artificial Neural Network, Adaptive Neuro Fuzzy Inference System and Support Vector Machine for Forecasting River Flow in the Semiarid Mountain Region. J. Hydrol. 509, 379–386. |
| [14] | Zhang, Y., Fitch, P., Vilas, M. P., and Thorburn, P. J. (2019). Applying MultiLayer Artificial Neural Network and Mutual Information to the Prediction of Trends in Dissolved Oxygen. Front. Environ. Sci. 7, 46. |
| [15] | Chen, Lh., Zhang, Xy. (2009). Application of Artificial Neural Networks to Classify Water Quality of the Yellow River. In: Cao, By., Zhang, Cy., Li, Tf. (eds) Fuzzy Information and Engineering. Advances in Soft Computing, vol 54. Springer, Berlin, Heidelberg. |
| [16] | Ahmed, A. M. Prediction of dissolved oxygen in Surma River by biochemical oxygen demand and chemical oxygen demand using the artificial neural networks (ANNs). J. King Saud. Univ.-Eng. Sci. 2017, 29, 151–158. |
| [17] | Selim, A.; Shuvo, S. N. A.; Islam, M.; Moniruzzaman, M.; Shah, S.; Ohiduzzaman, M. Predictive models for dissolved oxygen in an urban lake by regression analysis and artificial neural network. Total Environ. Res. Themes 2023, 7, 100066. |
| [18] | Areerachakul, S.; Junsawang, P.; Pomsathit, A. Prediction of dissolved oxygen using artificial neural network. Int. Conf. Comput. Commun. Manag. 2011, 5, 524–528. |
| [19] | Zhu, S.; Heddam, S. Prediction of dissolved oxygen in urban rivers at the Three Gorges Reservoir, China: Extreme learning machines (ELM) versus artificial neural network (ANN). Water Qual. Res. J. 2020, 55, 106–118. |
| [20] | Gorgan-Mohammadi, F.; Rajaee, T.; Zounemat-Kermani, M. Decision tree models in predicting water quality parameters of dissolved oxygen and phosphorus in lake water. Sustain. Water Resour. Manag. 2023, 9, 1. |
| [21] | Krivoguz, D.; Semenova, A.; Malko, S. Performance of machine learning algorithms in predicting dissolved oxygen concentration. In Proceedings of the International Scientific Conference on Agricultural Machinery Industry “Interagromash”, Rostov-on-Don, Russia, 25–27 May 2022; Springer: Cham, Switzerland, 2022; pp. 1137–1144. |
| [22] | Moon, J.; Lee, J.; Lee, S.; Yoon, H. Urban River Dissolved Oxygen Prediction Model Using Machine Learning. Water 2022, 14, 1899. |
| [23] | Arora, S.; Keshari, A. K. Dissolved oxygen modelling of the Yamuna River using different ANFIS models. Water Sci. Technol. 2021, 84, 3359–3371. |
| [24] | Khan, P. W.; Byun, Y. C. Optimized Dissolved Oxygen Prediction Using Genetic Algorithm and Bagging Ensemble Learning for Smart Fish Farm. IEEE Sens. J. 2023, 23, 15153–15164. |
| [25] | Kozhiparamban, R. A. H.; Swetha, P.; Harigovindan, V. Accurate Dissolved Oxygen Prediction for Aquaculture Using Stacked Ensemble Machine Learning Model. Natl. Acad. Sci. Lett. 2023, 46, 203–207. |
| [26] | Guo, P.; Liu, H.; Liu, S.; Xu, L. Numeric Prediction of Dissolved Oxygen Status Through Two-Stage Training for Classification Driven Regression. In Proceedings of the 2019 International Conference on Machine Learning and Cybernetics (ICMLC), Kobe, Japan, 7–10 July 2019; IEEE Computer Society: Washington, DC, USA, 2019. |
| [27] | Altunkaynak, A., Özger, M., and Çakmakcı, M. (2005). Fuzzy Logic Modeling of the Dissolved Oxygen Fluctuations in Golden Horn. Ecol. Model. 189, 436–446. |
| [28] | Giusti, E., and Marsili-Libelli, S. (2009). Spatio-Temporal Dissolved Oxygen Dynamics in the Orbetello Lagoon by Fuzzy Pattern Recognition. Ecol. Model. 220, 2415–2426. |
| [29] | Heddam, S. (2014). Modeling Hourly Dissolved Oxygen Concentration (Do) Using Two Different Adaptive Neuro-Fuzzy Inference Systems (ANFIS): A Comparative Study. Environ. Monit. Assess. 186, 597–619. |
| [30] | Tarmizi, A., Ahmed, A. N., and El-Shafie, A. (2014). Dissolved Oxygen Prediction Using Support Vector Machine in Terengganu River Middle-East. J. Sci. Res. 21 (11), 2182–2188. |
| [31] | Yu, H., Chen, Y., Hassan, S., and Li, D. (2016). Dissolved Oxygen Content Prediction in Crab Culture Using a Hybrid Intelligent Method. Sci. Rep. 6, 27292. |
| [32] | Ji, X., Shang, X., Dahlgren, R. A., and Zhang, M. (2017). Prediction of Dissolved Oxygen Concentration in Hypoxic River Systems Using Support Vector Machine: A Case Study of Wen-Rui Tang River, china. Environ. Sci. Pollut. Res. 24, 16062–16076. |
| [33] | Tsakiri, K., Marsellos, A., & Kapetanakis, S. (2018). Artificial Neural Network and Multiple Linear Regression for Flood Prediction in Mohawk River, New York. Water, 10(9), 1158. |
| [34] | Breiman, L. Random forests. Mach. Learn. 2001, 45, 5–32. |
| [35] | Prajwala, T. R. A comparative study on decision tree and random forest using R tool. Int. J. Adv. Res. Comput. Commun. Eng. 4, 196–199 (2015); |
| [36] | Chen, Y. T. (2021). Analytical comparison of random forest and gradient boosting decision trees for integrated learning algorithms. J. Comput. Knowl. Technol. 17 (15), 32–34. |
| [37] | Friedman, J. H. Greedy Function Approximation: A Gradient Boosting Machine. Ann. Stat. 2001, 29. |
| [38] | Bentéjac, C.; Csörgo, A.; Martínez-Muñoz, G. A Comparative Analysis of XGBoost. arXiv 2019, arXiv: abs/1911.01914. |
| [39] | Jerome, H. F. (2001). Greedy function approximation: a gradient boosting machine. J. Ann. Statistics 11 (10), 877–884. |
| [40] | Otchere, D. A., Ganat, T. O. A., Ojero, J. O., Tackie-Otoo, B. N. & Taki, M. Y. Application of gradient boosting regression model for the evaluation of feature selection techniques in improving reservoir characterization predictions. J. Pet. Sci. Eng. 208, 109244 (2022). |
| [41] | Chicco, D., Warrens, M. J. & Jurman, G. The coefficient of determination R-squared is more informative than SMAPE, MAE, MAPE, MSE and RMSE in regression analysis evaluation. Peerj Comput. Sci. 7, e623 (2021). |
| [42] | Althoff, D. & Rodrigues, L. N. Goodness-of-fit criteria for hydrological models: model calibration and performance assessment. J. Hydrol. 600, 126674 (2021). |
| [43] | Garabaghi, F. H., Benzer, S., & Benzer, R. (2023). Modeling dissolved oxygen concentration using machine learning techniques with dimensionality reduction approach. Environmental Monitoring and Assessment, 195(7), 879. |
| [44] | Li, S., Qasem, S. N., Band, S. S., Ameri, R., Pai, H. T., & Mehdizadeh, S. (2024). Explainable machine learning models for estimating daily dissolved oxygen concentration of the Tualatin River. Engineering Applications of Computational Fluid Mechanics, 18(1). |
| [45] | Krivoguz, D., Semenova, A., & Malko, S. (2022, May). Performance of machine learning algorithms in predicting dissolved oxygen concentration. In A. Beskopylny, M. Shamtsyan, & V. Artiukh (Eds.), International scientific conference on agricultural machinery industry “interagromash” (pp. 1137–1144). Springer International Publishing. |
| [46] | Ahmed, M. H. Prediction of the Concentration of Dissolved Oxygen in Running Water by Employing A Random Forest Machine Learning Technique. J. Hydrol. 2021. |
| [47] | Ay, M.; Ki¸si, Ö. Estimation of dissolved oxygen by using neural networks and neuro fuzzy computing techniques. J. Civil Eng. 2017, 21, 1631–1639. |
APA Style
Bangoura, A. M., Agbazo, N. M., Kamano, S. M., Bangoura, M., Bangoura, K. (2026). Dissolved Oxygen Concentrations Modeling of the Tighen River Water Using Physicochemical Variables and Various Machine-Learning Algorithms in Guinea Republic. American Journal of Applied Chemistry, 14(3), 42-51. https://doi.org/10.11648/j.ajac.20261403.11
ACS Style
Bangoura, A. M.; Agbazo, N. M.; Kamano, S. M.; Bangoura, M.; Bangoura, K. Dissolved Oxygen Concentrations Modeling of the Tighen River Water Using Physicochemical Variables and Various Machine-Learning Algorithms in Guinea Republic. Am. J. Appl. Chem. 2026, 14(3), 42-51. doi: 10.11648/j.ajac.20261403.11
AMA Style
Bangoura AM, Agbazo NM, Kamano SM, Bangoura M, Bangoura K. Dissolved Oxygen Concentrations Modeling of the Tighen River Water Using Physicochemical Variables and Various Machine-Learning Algorithms in Guinea Republic. Am J Appl Chem. 2026;14(3):42-51. doi: 10.11648/j.ajac.20261403.11
@article{10.11648/j.ajac.20261403.11,
  author = {Abdoulaye Missira Bangoura and Noukpo Medard Agbazo and Saa Moussa Kamano and Mafory Bangoura and Kande Bangoura},
  title = {Dissolved Oxygen Concentrations Modeling of the Tighen River Water Using Physicochemical Variables and Various Machine-Learning Algorithms in Guinea Republic},
  journal = {American Journal of Applied Chemistry},
  volume = {14},
  number = {3},
  pages = {42-51},
  doi = {10.11648/j.ajac.20261403.11},
  url = {https://doi.org/10.11648/j.ajac.20261403.11},
  eprint = {https://article.sciencepublishinggroup.com/pdf/10.11648.j.ajac.20261403.11},
  abstract = {Dissolved oxygen is an essential indicator of water pollution and the critical water quality constituent that impacts aquatic life. Thus, accurate modeling of its concentration is vital for freshwater resource management and protection. Despite this, in the African context, more specifically West Africa, there is virtually no scientific work that has focused on modeling dissolved oxygen concentrations in rivers and lakes. This preliminary work attempted to model and estimate, using others microbiological and physicochemical parameters and machine learning algorithms, the dissolved oxygen concentration of the Tighen River water in the Republic of Guinea. Based on two alternatives, three algorithms such as multiple linear regression (MLR), random forest (RF), and gradient boosting (GB) were employed to model and estimate dissolved oxygen concentrations. Alternative 1 referred to when microbiological and physicochemical parameters exhibiting correlations greater than + 0.1 or less than − 0.1 with dissolved oxygen are used for modeling its concentration, while alternative 2 referred to when variables exhibiting statistically significant correlations with dissolved oxygen are used. Results obtained from the models were evaluated using Nash-Sutcliffe efficiency coefficient (NSE), mean absolute error (MAE), Pearson correlation coefficient (RP), and root mean square error (RMSE) to identify the appropriate alternative and algorithm to model and estimate the dissolved oxygen. In the testing phase, the results showed that (1) among tested alternatives, alternative 2 quasi-systematically presents a smaller RMSE and MAE, and higher NSE and RP, indicating that it is significantly better than the alternative 1. (2) among the employed algorithms, under alternative 2, the RF algorithm exhibits the best performance in modeling dissolved oxygen, therefore, RF outperforms, MLR, and GB algorithm. These findings provide a scientific reference to enhance freshwater resource management and protection in Tighen river.},
 year = {2026}
}
TY  - JOUR
T1  - Dissolved Oxygen Concentrations Modeling of the Tighen River Water Using Physicochemical Variables and Various Machine-Learning Algorithms in Guinea Republic
AU  - Abdoulaye Missira Bangoura
AU  - Noukpo Medard Agbazo
AU  - Saa Moussa Kamano
AU  - Mafory Bangoura
AU  - Kande Bangoura
Y1  - 2026/05/27
PY  - 2026
N1  - https://doi.org/10.11648/j.ajac.20261403.11
DO  - 10.11648/j.ajac.20261403.11
T2  - American Journal of Applied Chemistry
JF  - American Journal of Applied Chemistry
JO  - American Journal of Applied Chemistry
SP  - 42
EP  - 51
PB  - Science Publishing Group
SN  - 2330-8745
UR  - https://doi.org/10.11648/j.ajac.20261403.11
AB  - Dissolved oxygen is an essential indicator of water pollution and the critical water quality constituent that impacts aquatic life. Thus, accurate modeling of its concentration is vital for freshwater resource management and protection. Despite this, in the African context, more specifically West Africa, there is virtually no scientific work that has focused on modeling dissolved oxygen concentrations in rivers and lakes. This preliminary work attempted to model and estimate, using others microbiological and physicochemical parameters and machine learning algorithms, the dissolved oxygen concentration of the Tighen River water in the Republic of Guinea. Based on two alternatives, three algorithms such as multiple linear regression (MLR), random forest (RF), and gradient boosting (GB) were employed to model and estimate dissolved oxygen concentrations. Alternative 1 referred to when microbiological and physicochemical parameters exhibiting correlations greater than + 0.1 or less than − 0.1 with dissolved oxygen are used for modeling its concentration, while alternative 2 referred to when variables exhibiting statistically significant correlations with dissolved oxygen are used. Results obtained from the models were evaluated using Nash-Sutcliffe efficiency coefficient (NSE), mean absolute error (MAE), Pearson correlation coefficient (RP), and root mean square error (RMSE) to identify the appropriate alternative and algorithm to model and estimate the dissolved oxygen. In the testing phase, the results showed that (1) among tested alternatives, alternative 2 quasi-systematically presents a smaller RMSE and MAE, and higher NSE and RP, indicating that it is significantly better than the alternative 1. (2) among the employed algorithms, under alternative 2, the RF algorithm exhibits the best performance in modeling dissolved oxygen, therefore, RF outperforms, MLR, and GB algorithm. These findings provide a scientific reference to enhance freshwater resource management and protection in Tighen river.
VL  - 14
IS  - 3
ER  -
Department of Chemistry, University of NZerekore, NZerekore, Guinea
Department of Hydrology, University of NZerekore, NZerekore, Guinea
Fishing and aquaculture, Higher Institute of Sciences and Veterinary Medicine of Dalaba, Dalaba, Guinea
4Dramatic Arts, Mory Kante Higher Institute of Arts of Dubreka, Conackry, Guinea
Departement of Hydrology, Marine and Coastal Scientific Research Center, Conakry, Guinea
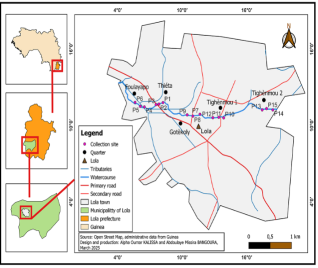
Figure 1. Study area and sampling locations.
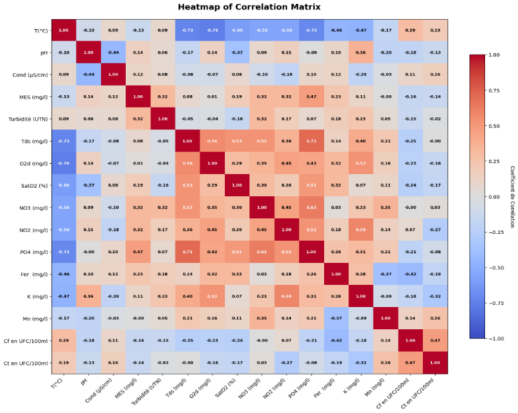
Figure 2. Correlation Heat map between the physico-chemical, and microbiological parameters of the waters from the different study sites.
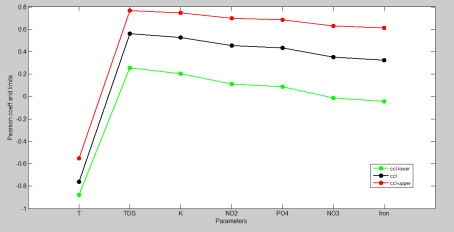
Figure 3. Pearson coefficient between dissolved oxygen and other parameters. Red and green represent the upper bound and the lower bound of the 95% confidence interval. Black represents the Pearson coefficient.
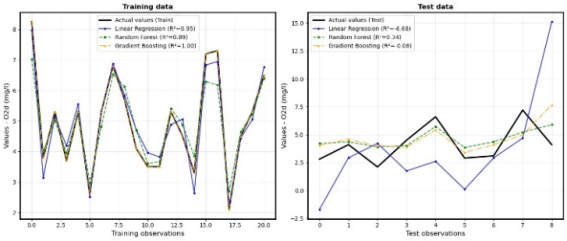
Figure 4. Comparison of observed and predicted dissolved oxygen concentrations by the three models on the training (left) and test (right) sets on all variables.
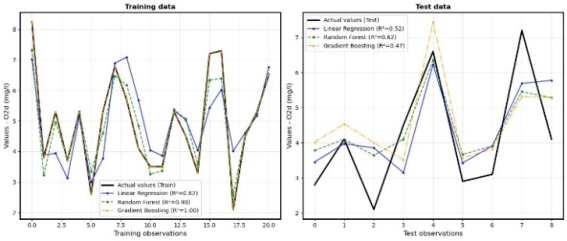
Figure 5. Comparison of observed and predicted dissolved oxygen concentrations by the three models on the training (left) and test (right) sets on selected variables.
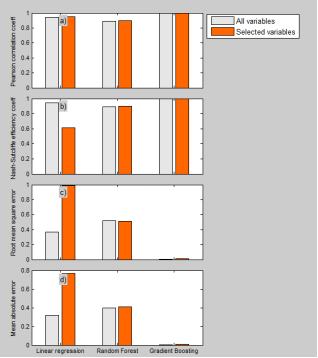
Figure 6. Performance of the three models in modeling dissolved oxygen concentrations during the training phase by using variables exhibiting correlations greater than + 0.1 or less than − 0.1 with dissolved oxygen.
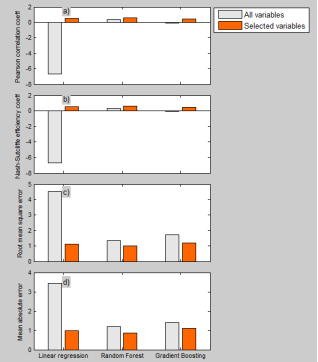
Figure 7. Performance of the three models in modeling dissolved oxygen concentrations during the training phase by using variables exhibiting statistically significant correlations with dissolved oxygen.

Information


 Share This Article
 Twitter
 Linked In
 Facebook
 Copy
Copy Download