Research Article | | Peer-Reviewed

Physicochemical Quality Evaluation of Commercial Soaps Marketed in North Western Nigeria

Received: 7 May 2026     Accepted: 22 May 2026     Published: 16 November 2026
Views:       Downloads:
Abstract

This research evaluated the physicochemical properties of selected commercial soaps sourced from prominent markets in north-western Nigeria. A total of forty soap samples including toilet, laundry, medicated, and multipurpose soaps, were randomly acquired from central markets located in Katsina State, Kano State, Kaduna State, and Jigawa State. The samples were transported to the laboratory, grated and underwent physicochemical analysis following standard analytical methods. The parameters assessed included total fatty matter(TFM), alcohol insoluble matter(AI), free alkali(FA), pH, moisture content(MC), and hardness(Hdn). Total fatty matter values were found to range from 54.13% to75.36% in toilet soaps, 45.38% to76.09% in laundry soaps, 68.32% to 78.55% in medicated soaps, and 58.46% to 76.09% in multipurpose soaps. Several samples met or surpassed the recommended limits set by the Standards Organisation of Nigeria. However, some products displayed high levels of alcohol insoluble matter and free alkali, which could potentially impact product quality and skin compatibility. The pH values varied from 6.45 to 9.58, indicating a range from mildly acidic to strongly alkaline, with several samples exceeding the recommended pH range for skin-friendly soaps. Moisture content and hardness also exhibited significant variation among the samples analyzed. Analysis of variance (ANOVA) revealed no significant differences (p>0.05) among the soap categories concerning the measured physicochemical parameters. Correlation analysis demonstrated a strong negative correlation between TFM and AI (r=−0.619, p<0.01), indicating that higher fatty matter content was associated with lower levels of insoluble materials. Additionally, moisture content showed a very strong positive correlation with hardness (r=0.947, p<0.01), while moderate positive correlations were noted between pH and other parameters.

Published in American Journal of Applied Chemistry (Volume 14, Issue 6)
DOI 10.11648/j.ajac.20261406.11
Page(s) 109-120
Creative Commons

This is an Open Access article, distributed under the terms of the Creative Commons Attribution 4.0 International License (http://creativecommons.org/licenses/by/4.0/), which permits unrestricted use, distribution and reproduction in any medium or format, provided the original work is properly cited.

Copyright

Copyright © The Author(s), 2026. Published by Science Publishing Group

Keywords

Soaps, Physico-chemical Parameters, Multi-purpose, Laundry, Medicated

1. Introduction
Back ground of the Study
The quality of commercial soaps in North-western Nigeria shows quite a bit of variation, with many not meeting the required standards. To tackle this issue, there is need to enforce regulatory standards more strictly, educate consumers about the importance of buying from trust worthy sources, and support local manufacturers who are dedicated to producing quality products . Making soap involves a reaction between vegetable oils and / or animal fats with either sodium hydroxide or potassium hydroxide . This process, known as "saponification," breaks down triglycerides using a base (usually NaOH or KOH) to create three salts (soap) and glycerol. The type of base used can influence how the molecules crystallize. KOH is typically preferred for liquid or soft soaps, while NaOH is better for creating a firmer bar .
Oil + 3NaOH = Glycerol + 3Soap(1)
Soap is essentially a compound made from fatty acids that have been mixed with salt. Each soap molecule features a long hydrocarbon chain with a carboxylic acid group at one end, which forms anionic bond with a metal ion, typically sodium or potassium . The ionic part loves water, making it soluble, while the hydrocarbon end is non polar and prefers non polar substances. This unique structure allows soaps to emulsify or suspend insoluble materials in water, making them effective cleaners . From a chemical stand point, soap is an alkali metal salt derived from long-chain mono carboxylic acids, serving as a cleaning agent. It's often represented by the formula CH3COONa, where CH3COONa indicates the polar group, and R represents the hydrocarbon chain . For soaps to be effective, they typically have a hydrophobic carbon chain ranging from 12 to 18 carbon atoms. As noted by , if the hydrophobic part has fewer than 12 carbon atoms, it struggles to remove oil; conversely, if it has more than 18 carbon atoms, it behaves more like a deter gent, although the term "detergent" is generally reserved for synthetic versions. In essence, soap is a widely used cleaning agent that can come in various forms—granules, bars, flakes, or liquids—created by reacting sodium or potassium salts with natural fatty acids .
Soap can be described as any water-soluble salt made from fatty acids that have eight or more carbon atoms. It's produced for a range of uses, such as washing, bathing, and even for medicinal purposes . The main reason soap is being use with water for cleaning is that the hydrocarbon chain loves to bond with oil and grease, while the carboxylic group is more compatible with water . Several factors influence the process and quality of soap, including the type of oil, the amount of caustic soda, and the water content .
The interaction rate between the oil and caustic soda is affected by the free fatty acid content of the oil and how vigorously the mixing is done. Heat, quick mixing, and the presence of free fatty acids all help speed up the soap-making process . The physicochemical properties of soaps play a crucial role in determining their quality and effectiveness in washing. These properties include pH, moisture content, free fatty acids, total fatty matter, free caustic alkali, and hardness .
To enhance the quality of the soap, additional chemicals are often included in the mix. For example, when creating medicated soap, extra medicinal ingredients are added for therapeutic use . Besides potassium and sodium salts, other metals like calcium, magnesium, and chromium are used to create metallic insoluble soap, which serves purposes beyond just cleaning. The type of metallic element in the salt also influences other characteristics of the soap, such as its hardness .
When the same type of fat or oil is used in both cases, soap made from sodium salts tends to be harder than soap made from potassium salts. This is different from soaps made with divalent metals like calcium, magnesium, aluminum, or iron, which don’t dissolve in water. Soaps are commonly used for laundry and cleaning, and interestingly, calcium soap has even been noted as an ingredient in animal feed . Typically, triglycerides—essentially fats or oils—are transformed into soap through a process called saponification. During this process, when triglycerides react with a strong alkali like potassium or sodium hydroxide, glycerol and fatty acid salts are produced . The term “soap" refers to these fatty acid salts. The following equations show the typical reactions involved in saponification:
C3H5(OOCR)3+ 3KOH3KOOCR + C3H5(OH)3(2)
Fat Potassium hydroxide Soap Glycerol
or
C3H5(OOCR)3+ 3NaOH3NaOOCR + C3H5(OH)3(3)
Fat Sodium hydroxide Soap Glycerol
Physicochemical parameters refer to the physical and chemical properties of a substance that influence how it behaves and performs. These parameters help describe various characteristics, including electrical and thermal properties. In the realm of soap analysis, physicochemical parameters encompass aspects like pH, total fatty matter, moisture content, free alkalinity, penetration value, hardness, lather volume, and lather stability. All of these factors are crucial for assessing the soap’s performance, quality, and safety. Consequently, this study zeroes in on the physicochemical analysis of selected soaps available in states within the north west geopolitical zone.
2. Materials and Methods
2.1. Study Area
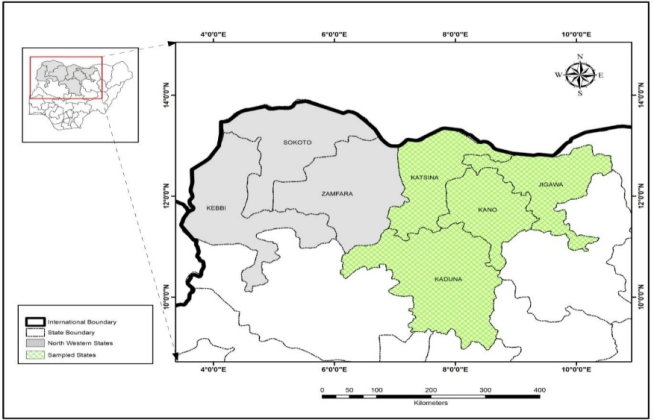
Katsina State occupies an area of 29,938 km2 lying between latitude 11°7’N and 13°32’N and longitude 6°52’ and 9°02”. Kaduna state lies between latitude 10°26’N to 10°40’N and longitude 7°19’E to 7°33’E. Kano state also lies between latitude 11°55’N and 12°3’N and longitude 8°27’E to 8°36 E, having an elevation of 472m above sea level. Jigawa state has a location of 10°N and 12°N and a longitude of 7°E and 10°E, which covers an approximate land area of about 22,410km2. The map of the study area is demonstrated in Figure 1 below.
Figure 1. Map of the study area.
2.2. Sample Collection and Processing
The medicated, laundry, multipurpose, and toilet soaps were obtained from Katsina, Kano, Kaduna, and Jigawa Central Markets, north-west geopolitical zone Nigeria. All the samples (40soaps) were randomly collected and aseptically transported to Umar Musa Yar’adua University Central laboratory for analysis . Each soap sample was finely grated using a sterilized grater, and was placed in cleaned plastic container until further used .
2.3. Physicochemical Analysis
2.3.1. Moisture Content
Moisture content was determined as described by . The granulated sample, 5.0g was weighed in a dried crucible and place in the oven at 103˚C for 2hrs 30mins. The crucible plus sample was allowed to cool in desiccators and then re-weighed. The percent moisture content was determined by employing equation (1):
%Moisture content=Cs-ChCs-Cw×100
Where;
Cw= weight of the crucible
Cs=weight of crucible + sample
Ch=weight of crucible + sample after oven drying.
2.3.2. pH
The pH was determined as described in . The granulated soap (2.0g) was dissolved in 20ml distilled water to make a 10% soap solution. Then the solution was left to stand overnight to allow the complete dissolution of soap. The pH was calibrated using a buffer solution. All the soap samples pH was measured with a pH meter on the following day.
2.3.3. Total Fatty Matter
Total fatty matter was determined as described in . The sample (5.0g) was weighed and in an empty crucible and a 100ml of ethanol (50%v/v) was added. Then the mixture was heated on the water bath until the entire sample has been dissolved and while the solution is still hot, a 40ml 0.5 Normal nitric acid was added and shook vigorously. The solution was left to cool at room temperature and the resulting substance was weighed in order to calculate the total fatty matter using equation (2) below:
%Totalfattymatter=Y-XWs×100
Where:
Y= weight of crucible + sample after evaporation
X= weight of empty crucible
Ws= weight of sample
2.3.4. Free Alkali
Free alkali was determined as in . The sample (2.5g) was dissolved in 15ml distilled ethanol and heated in the water bath until the sample had completely dissolved. This was then followed by addition of 5 drops of phenolphthalein indicator and 5ml of 20% BaCl2. The resultant solution was titrated against 0.05M H2SO4 in order to neutralize the sodium hydroxide, NaOH present to the disappearance of pink colour. The free caustic alkali was calculated using equation (3):
% freeAlkali=0.31×VaW
Where;
Va= volume of acid
W= weight of sample
2.3.5. Alcohol Insoluble
To analyze the soap sample, we started with 5.0g, which was dissolved in 50mL of alcohol. This mixture was then carefully transferred to a pre-weighed filter paper. After that, the residue was dried in an oven at 105°C for 30minutes, cooled in desiccators, and weighed again . We calculated the amount of insoluble matter in alcohol (MIA) using equation, (4), as out lined by .
%Alcohol Insoluble Matter=(Ws-FP)/W×100
Where:
Ws is the Weight of the sample + filter paper,
FP is the Weight of the filter paper, and
W is the Weight of the sample.
2.3.6. Hardness (Penetration Value)
To test the hardness of the soap, we used a needle to pierce the surface. The depth to which the needle penetrated the soap bar indicated its hardness .
2.4. Statistical Analysis
The data collected from the study were analysed using the Statistical Package for Social Sciences (SPSS, Version20). Descriptive statistics were employed to summarize the data, while correlation analysis helped us understand the relationships among the different parameters. Also ANOVA was used to determine any significant differences in the soaps across various states within the geopolitical zone.
3. Results
Tables 1 through 6 resent the mean and standard deviation values for laundry, toilet, multipurpose, and medicated soaps, along with their corresponding reference values from the Standards Organisation of Nigeria(SON). Physicochemical characterizations of the different soaps was conducted which include TFM, AI, FA, pH, moisture content(MC), and hardness(Hdn), as well as their microbial analysis.
Table 1 displays the mean and standard deviation values for key parameters of the toilet soap samples (T1–T10). The parameters evaluated include total fatty matter(TFM), alkali insoluble(AI), free alkali(FA), pH, moisture content(MC), and hardness(Hdn). Additionally, standard values provided by standard organization of Nigeria (SON) was used for comparison.
The TFM content ranges between 54.13±0.31(T2) and 75.36±0.52(T1), with most samples meeting or exceeding the SON recommended range of 50-65. The AI varies widely, from as low as 0.85±0.08(T1) to 34.33±0.45(T2). High AI values, such as in T2 andT4, may indicate the presence of unreacted alkali, which could lead to skin irritation. All samples have FA values within the acceptable limit of 0.1 specified by SON. The FA is minimal, with values ranging from 0.02±0.01(T1) to 0.16±0.01(T2), suggesting minimal residual alkali and good saponification. The pH values of the soap samples range between 6.60±0.08(T9) and 9.58±0.05(T6), mostly falling within the SON- recommended range of 6.5 – 8.5. MC content varies significantly, with the highest observed in T6(12.57±0.05) and the lowest in T10(7.01±0.01). The hardness values range from 4.50±0.58(T2) to 10.00±0.00(T3), indicating varying degrees of soap firmness.
Table 1. Mean and standard deviation values for toilet soap.

Sample

TFM%

AI%

FA%

pH

MC%

Hdn(mm)

T1

75.36±0.52

0.85±0.08

0.02±0.01

7.33±0.09

11.95±0.17

8.00±0.82

T2

54.13±0.31

34.33±0.45

0.16±0.01

9.08±0.09

5.22±0.15

4.50±0.58

T3

70.37±0.43

7.99±0.16

0.14±0.01

9.5±0.12

12.22±0.20

10.00±0.00

T4

63.57±0.29

22.0±0.11

0.04±0.01

6.63±0.05

8.15±1.21

6.00±0.00

T5

72.00±0.03

7.28±0.03

0.13±0.01

9.08±0.08

11.99±0.03

7.00±0.00

T6

62.01±0.43

11.64±0.73

0.15±0.01

9.58±0.05

12.57±0.05

8.50±0.85

T7

70.56±0.54

7.74±0.05

0.14±0.01

9.00±0.00

12.10±0.12

8.25±0.50

T8

60.85±0.11

20.16±0.03

0.08±0.01

8.58±0.30

7.02±0.02

5.25±0.50

T9

63.46±0.38

22.00±0.04

0.04±0.01

6.60±0.08

7.16±0.40

6.00±0.00

T10

59.90±0.08

19.51±0.01

0.10±0.01

7.55±0.06

7.01±0.01

7.00±0.00

SON

50-65

15.6

0.1

6.5-8.5

25.0

-

Key: T1-Lux, T2-Hala, T3-F/Glow, T4-Premier, T5-Nova, T6-Siri, T7-Eva, T8-S/Aloe, T9-F/Care, and T10-Safeguard
Table 2 show cases the average and standard deviation values for various quality parameters of laundry soap samples(L1–L10). These parameters include Total Fatty Matter(TFM), Alkali Content(AI), Free Alkali(FA), pH, Moisture content(MC), and Hardness(Hdn), with standards set by the SON(Standards Organisation of Nigeria) for reference. The TFM content varies from 45.38±0.28(L3) to 76.09±0.08(L9). According to SON, the acceptable range is between 70 and 76, and samples like L2, L6, L7, L9, and L10 either meet or surpass this standard, suggesting they have better cleaning capabilities. On the other hand, samples with lower TFM, such as L1, L3, and L4, might not clean as effectively. The AI values show quite a range, from a lo w of 0.11±0.01(L6) to a high of 29.20±0.24(L3), with most samples exceeding the SON limit of 3.0. FA levels range from 0.06±0.01(L2andL4) to 0.19±0.04(L1). The SON limit for FA is set at 0.1, and only samples L2, L4, and L6 fall within this limit. The pH values of the soaps range from 7.20±0.24(L5) to 9.48±0.10(L1). While SON recommends a pH range of 6.5–8.5, samples like L1 and L3 exceed this, which could make them to alkaline for everyday use. The MC values fluctuate between 14.63±0.02(L5) and 20.36±0.25(L1), with most samples above the SON limit of 13.0. Lastly, hardness values range from 14.00±0.00(L7) to 18.75±0.50(L3), showing some differences in firmness.
Table 2. Mean and standard deviation values for laundry soap.

Sample

TFM%

AI%

FA%

pH

MC%

Hdn(mm)

L1

58.46±0.50

16.21±0.25

0.19±0.04

9.48±0.10

20.36±0.25

18.50±0.58

L2

71.89±0.34

0.88±0.02

0.06±0.1

8.00±0.08

16.22±0.35

18.00±0.81

L3

45.38±0.28

29.20±0.24

0.17±0.01

9.30±0.08

19.80±0.28

18.75±0.50

L4

57.82±0.15

18.00±0.11

0.06±0.01

8.00±0.08

16.20±0.35

18.00±0.82

L5

63.75±0.32

15.84±0.42

0.08±0.01

7.20±0.24

14.63±0.02

15.00±0.00

L6

70.42±0.16

0.11±0.01

0.07±0.01

8.53±0.05

15.56±0.08

18.25±0.50

L7

73.28±0.15

14.52±0.55

0.07±0.02

7.95±0.06

14.73±0.32

14.00±0.00

L8

65.44±0.26

14.10±0.62

0.11±0.01

8.03±0.05

15.59±0.28

17.00±0.00

L9

76.09±0.08

13.45±0.44

0.15±0.01

8.75±0.29

16.40±0.04

15.25±0.50

L10

75.80±0.01

16.22±0.03

0.18±0.03

8.38±0.25

16.25±0.16

14.75±0.50

SON

70-76

3.0

0.1

6.5-8.5

13.0

-

Key; L1-Waw, L2-Vplus, L3-Nittol, L4-Suban, L5-Manuka, L6-Mamuda, L7-2lemon, L8-Caneo, L9-2sure, and L10-VL+
Table 3 show cases the average and standard deviation values for important parameters of medicated soap samples (M1–M10). The Total Fatty Matter (TFM) content varies from 68.32±0.22(M8) to 78.55±0.36(M3). According to SON guide lines, the ideal range is between 70 and 76. Most samples fit within this range, except for M3, which goes over the limit, and M8, which falls short. The AI values show a wide range, from 0.87±0.11(M1) to 16.66±0.08(M6), with only M1, M4, and M8 meeting the SON threshold of 3.0. FA values span from 0.02±0.01(M3 and M4) to 0.47±0.02(M10), while the SON –recommended maximum is 0.05. The pH levels range from 6.45±0.06(M6) to 9.08±0.05(M5). Although most samples are within the SON range of 6.5 to 8.5, M5 exceeds the upper limit. MC values fluctuate between 3.74±0.10(M3) and 9.99±0.07(M4). The SON limit is set at 5.0, and samples like M1, M3, M5, M6, and M9 are compliant. Lastly, the hardness values range from 2.00±0.00(M3) to 7.75±0.50(M4).
Table 3. Mean and standard deviation values for medicated soap.

Sample

TFM%

AI%

FA%

pH

MC%

Hdn(mm)

M1

71.66±0.53

0.87±0.11

0.03±0.01

7.65±0.10

5.17±0.57

4.00±0.00

M2

74.61±0.56

5.72±0.06

0.11±0.01

8.28±0.05

7.77±0.11

6.25±0.50

M3

78.55±0.36

7.15±0.14

0.02±0.01

7.60±0.00

3.74±0.10

2.00±0.00

M4

76.20±0.11

3.72±0.06

0.02±0.01

7.60±0.05

9.99±0.07

7.75±0.50

M5

70.07±0.01

16.36±0.05

0.12±0.01

9.08±0.05

4.11±0.11

3.00±0.00

M6

70.53±0.34

16.66±0.08

0.23±0.01

6.45±0.06

4.37±0.05

3.00±0.00

M7

72.51±0.55

13.93±0.55

0.13±0.01

6.75±0.06

4.75±0.05

3.25±0.50

M8

68.32±0.22

1.10±0.10

0.25±0.02

6.63±0.05

6.36±0.15

5.50±0.58

M9

74.73±0.07

15.71±0.20

0.28±0.02

6.70±0.00

4.53±0.02

4.00±0.00

M10

73.22±0.02

14.85±0.10

0.47±0.02

6.90±0.00

6.10±0.04

5.00±0.00

SON

70-76

3.0

0.05

6.5-8.5

5.0

-

Key; M1-B/Septol, M2-Delta, M3-Sanitol, M4-Septol, M5-D/Even, M6-D/Cool, M7-DettolA, M8-2sure, M9-Dosun, and M10-Tetmosol.
Table 4 show cases the average and standard deviation values for the quality parameters of various multipurpose soap samples (Mp1–Mp10). The Total Fatty Matter (TFM) values range from 58.46±0.49 for Mp3 to 76.09±0.09 for Mp2. Soaps with higher TFM values, like Mp2, Mp6, and Mp5, are known for their better cleansing and moisturizing abilities. The Alcohol Insoluble (AI) values fluctuate between 0.88±0.02 for Mp1 and 16.29±0.20 for Mp10. Only Mp1 falls below the ideal AI threshold of 3.0, suggesting it's the safest option for multipurpose use. The Free Alkaline (FA) values span from 0.06±0.01 for Mp1 to 0.21±0.01 for Mp10, with most samples surpassing the ideal FA threshold of 0.1. The pH values range from 7.35±0.41 for Mp8 to 9.58±0.05 for Mp4. While it's important for multipurpose soaps to maintain a balanced alkalinity, samples like Mp4 and Mp3 go beyond the optimal pH range of 6.5–8.5. The Moisture content (MC) values vary from 12.55±0.06 for Mp4 to 20.36±0.25 for Mp3, with SON recommending a limit of 5.0. Hardness values range from 8.50±0.58 for Mp4 to 18.50±0.58 for Mp3. Harder soaps, such as Mp3 and Mp1, dissolve more slowly, making it ideal for longer-lasting use.
Table 4. Mean and standard deviation values for multipurpose soap.

SampleID

TFM%

AI%

FA%

pH

MC%

Hdn(mm)

Mp1

71.88±0.35

0.88±0.02

0.06±0.01

8.00±0.08

16.22±0.36

18.00±0.82

Mp2

76.09±0.09

13.45±0.44

0.15±0.01

8.75±0.29

16.36±0.04

15.25±0.50

Mp3

58.46±0.49

16.21±0.25

0.19±0.04

9.48±0.10

20.36±0.25

18.50±0.58

Mp4

62.01±0.42

11.64±0.73

0.15±0.01

9.58±0.05

12.55±0.06

8.50±0.58

Mp5

73.28±0.15

14.52±0.55

0.07±0.02

7.95±0.06

14.73±0.32

14.00±0.00

Mp6

75.80±0.01

16.23±0.03

0.18±0.03

8.38±0.25

16.25±0.16

14.75±0.50

Mp7

65.44±0.26

14.10±0.62

0.11±0.01

8.03±0.05

15.59±0.28

17.00±0.00

Mp8

63.82±0.39

13.26±0.25

0.12±0.01

7.35±0.41

16.15±0.10

14.50±0.58

Mp9

64.78±0.01

15.28±0.32

0.15±0.02

8.07±0.05

16.60±0.45

12.50±0.58

Mp10

70.57±0.06

16.29±0.20

0.21±0.01

8.13±0.25

17.43±0.49

15.60±0.00

SON

50-65

15.6

0.1

6.5-8.5

25.0

Key: Mp1-Viva+, Mp2-2Sure, Mp3-Waw, Mp4-Fizz, Mp5-Vlemon+, Mp6-Fcare, Mp7-Key, Mp8-Bright, Mp9-Kifi, Mp10-Zuma
Table 5 presents the means, standard deviations (SDs), sample sizes (N), and P-values for various physicochemical parameters of different soap categories: Toilet, Laundry, Medicated, and Multipurpose soaps. The parameters analysed include Total Fatty Matter (TFM), Alkaline Insoluble (AI), Free Alkali (FA), pH, Moisture Content (MC), and Hardness (Hdn).
Table 5. ANOVA for physicochemical parameters of soaps.

Brand

Mean

SD

N

P-value

Physicochemical parameters

Toilet

65.2210

6.33525

40

0.54

Laundry

65.8308

9.38844

40

0.54

TFM

Medicated

73.0377

2.97356

40

0.54

M/Purpose

68.2125

5.88155

40

1.00

Toilet

15.3488

9.55968

40

0.216

Laundry

13.8520

8.01816

40

0.216

AI

Medicated

9.6055

6.27238

40

1.000

M/Purpose

13.1843

4.41711

40

0.216

Toilet

0.0953

0.05139

40

0.325

Laundry

0.1133

0.05235

40

0.325

FA

Medicated

0.1655

0.13715

40

0.200

M/Purpose

0.1368

0.04922

40

0.117

Toilet

8.2900

1.11627

40

0.693

Laundry

8.3600

0.66979

40

0.693

pH

Medicated

7.3650

0.81005

40

1.000

M/Purpose

8.3698

0.69742

40

0.693

Toilet

9.5370

2.77562

40

1.000

Laundry

16.5745

1.88825

40

0.469

MC

Medicated

5.6883

1.87584

40

1.000

M/Purpose

16.2257

1.90770

40

0.469

Toilet

7.0500

1.64784

40

1.000

Laundry

16.7500

1.79386

40

1.000

Hdn

Medicated

4.3750

1.70501

40

1.000

M/Purpose

14.8000

2.80293

40

1.000

The correlation matrix (Table 6) shows the relationships between six physicochemical parameters: Total Fatty Matter (TFM), Alcohol Insoluble (AI), Free Alkali (FA), pH, Moisture Content (MC), and Hardness (Hdn). These relationships are evaluated using Pearson correlation coefficients, with significance levels indicating the strength and reliability of the correlations. TFM shows some interesting dynamics with various parameters. The most notable is its strong negative correlation with AI (-0.619, p<0.01), which means that as Total Fatty Matter goes up, the Alcohol Insoluble tends to drop significantly. There are also moderate negative correlations with pH(-0.294, p<0.01) and MC(-0.224, p<0.01), suggesting that higher TFM values are linked to lower pH and MC levels. On the flip side, TFM doesn’t really interact with FA or Hdn, indicating a lack of significant correlation there.
When it comes to AI, it has a weak positive correlation with FA (0.222, p<0.01), hinting at a slight tendency for both to rise together. However, AI doesn’t show significant correlations with other parameters like pH, MC, or Hdn, which means its behavior is mostly independent of these variables, except for TFM and FA. FA, on its part, has minimal correlations with the other parameters. While it does have a weak positive relationship with AI (0.222), it doesn’t significantly correlate with TFM, pH, MC, or Hdn. This suggests that FA operates largely on its own in this context.
The pH parameter, however, reveals more inter connected relationships. It has a moderate positive correlation with MC (0.479, p<0.01) and Hdn (0.364, p<0.01), indicating that higher pH levels tend to go hand in hand with increases in both MC and Hdn. Interestingly, pH also has a moderate negative correlation with TFM (-0.294, p<0.01), meaning that as pH rises, TFM tends to decrease. There are no significant relationships between pH and AI or FA. MC stands out with a strong positive correlation with Hdn (0.947, p<0.01), suggesting a nearly perfect relationship between these two. This implies that MC and Hdn are likely influenced by similar underlying factors or processes. MC also shows a moderate positive correlation with pH (0.479, p<0.01) and a moderate negative correlation with TFM (-0.224, p<0.01). However, it doesn’t significantly correlate with AI or FA, emphasizing its unique position in this analysis.
Finally, Hdn shows the strongest positive correlation in the matrix with MC, clocking in at 0.947(p<0.01), which really high lights the close relationship between these two para meters. On top of that, Hdn has a moderate positive correlation with pH at 0.364(p<0.01) and a moderate negative correlation with TFM at -0.223(p<0.01). Interestingly, Hdn doesn’t show any significant correlations with AI or FA, suggesting that its behavior is more closely linked to MC, pH, and TFM.
To sum it all up, the key take a ways include the strong negative relationship between TFM and AI, the moderate positive correlations of pH with MC and Hdn, and the exceptionally strong positive correlation between MC and Hdn. These relationships offer valuable insights into how the physicochemical parameters interact within the system being studied.
Table 6. Correlations Analysis between different Physicochemical Parameters of Soaps.

TFM

AI

FA

pH

MC

HD

TFM

Pearson Correlation

--

N

160

AI

Pearson Correlation

-.619**

--

Sig.(2-tailed)

.000

FA

Pearson Correlation

-.006

.222**

--

Sig.(2-tailed)

.940

.005

pH

Pearson Correlation

-.294**

.087

.000

--

Sig.(2-tailed)

.000

.274

.996

N

160

160

160

160

MC

Pearson Correlation

-.224**

-.001

-.047

.479**

--

Sig.(2-tailed)

.004

.990

.553

.000

Hdn

Pearson Correlation

-.223**

-.006

-.085

.364**

.947**

--

Sig.(2-tailed)

.005

.940

.286

.000

.000

**.Correlation is significant at the0.01level(2-tailed).

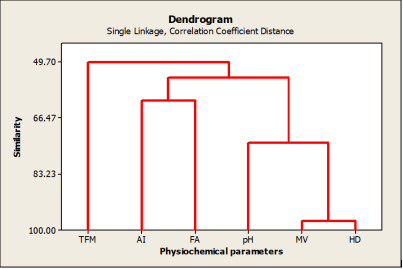
The dendrogram is a visual tool that illustrates the clustering process out lined in the table, making it easier to grasp the relationships between the physicochemical parameters. On the horizontal axis, you'll find the variables (TFM, AI, FA, pH, MC, and Hdn), while the vertical axis indicates the similarity levels at which these clusters come together. It all starts with each parameter as its own separate cluster. The first to join forces are MC and Hdn, merging at a high similarity level near the top of the dendrogram. This close pairing underscores their strong correlation and their shared roles in molecular stability and decomposition.
Next up, pH enters the MC-Hdn cluster, creating a larger group at a slightly lower similarity level. This combination highlights pH's regulatory influence on hydrolysis and its indirect effect on molecular volume. AI and FA, on the other hand, form their own unique cluster at a moderate similarity level, show casing a solid connection between these parameters as indicators of acidity and alkalinity. Their grouping suggests that they are both influenced by neutralization reactions happening within the system. As the clustering continues, the AI-FA cluster merges with the MC-Hdn-pH cluster at a lower similarity level. This indicates a broader, albeit weaker, relationship between the acidity-alkalinity parameters and those related to hydrolysis.
Finally, TFM joins the overall cluster at the lowest similarity level, which points to its relatively independent behavior compared to the other parameters. This last step highlights that while TFM isn't as tightly linked to the dynamics of the other variables, it still maintains some overall connection to the system. The dendrogram serves as a perfect complement to the amalgamation table, visually demonstrating how the clusters are formed and the varying strengths of the relationships among the parameters. It effectively show cases the hierarchical nature of the clustering process and paints a clear picture of how these physicochemical properties are interconnected.
Figure 2. The Dendrogram Shows the Similarities between various Physicochemical Parameters of Soaps.
4. Discussion
The data presented in Table 1 indicates that while several samples meet or even surpass SON standards for key quality parameters, there are some significant deviations worth noting. For example, T2 doesn't quite hit the minimum TFM requirement and has higher AI levels, which could potentially affect both its effectiveness and user safety. On the flipside, samples T1, T3, and T5 shine with their superior quality, boasting higher TFM content and compliance with other important parameters. This analysis really highlights how crucial it is to stick to regulatory standards to ensure the quality of soap and the safety of its users . These results also point out the variability in commercial soap formulations and the pressing need for stricter quality control measures. This aligns with the findings of , who reported the physicochemical properties of some soaps, including TFM(55.45), AI(3.5), MC(9.53), and FA(0.09). Additionally, it echoes the report by , which indicated the physicochemical parameters of soaps as pH(7.3), MC(10.4), TFM(34), FA(0.56), and AI(20).
Moving on to the analysis in Table 2, it shows that only a handful of samples meet the SON standards across all parameters. L9 and L10 really stand out as high-quality samples, closely aligning with SON specifications for TFM, pH, and FA. However, L1 and L3 show some significant discrepancies, including low TFM, high AI, and FA, making them less suitable for safe and effective cleaning. Moreover, most samples exceed the SON limit for MC, which could impact their durability. These findings emphasize the variability in laundry soap formulations and reinforce the necessity for strict adherence to regulatory standards to ensure product quality and consumer safety. The also noted a pH range of (5.5–8.0), moisture(10–16.2), TFM(71-84), AI(20-28), and FA(0.13–0.16).
Table 3 shows that most medicated soap samples meet the SON standards for Total Fatty Matter (TFM) and pH levels, which is great for ensuring effective cleansing and skin compatibility. However, we do see some notable discrepancies in the Alcohol Insoluble (AI) and FreeAlkali (FA) values. For instance, samples M6, M9, and M10 go beyond the acceptable limits, which could lead to skin irritation. On the brighter side, M4 stands out with a well-balanced profile, maintaining acceptable values across most parameters. In contrast, M5 and M6 exhibit significant deviations in AI, FA, and pH, which could compromise their effectiveness and safety. This aligns with findings from , which reported that the physicochemical properties of medical soaps typically range from pH(6.5-7.3), MC(10.4-14.0), TFM(34-65), FA(0.56-0.88), and AI(20-23).
The high moisture content in soap suggests that excess water might react with any unsaponified neutral fat, leading to the formation of free fatty acids and glycerol through a process known as hydrolysis during storage. Moisture content is a key factor in evaluating a product's shelf life . The alkaline nature of soap helps create a barrier against harmful bacteria and viruses by neutralizing the body's natural acidity (which ranges from 5.4 to 5.9), promoting a healthy environment and aiding in lathering. Additionally, soaps with a pH below 5 or above 10 can be harsh on the hands and skin . According to , high-quality soaps should have TFM values above 76%, although a minimum of 60% is considered acceptable for safe use of soaps made from selected tallows. The presence of free caustic alkali is another factor that influences the abrasiveness of soap. Based on this study's findings, some FA values fall within the recommended SON limits, while others exceed them. This variation maybe linked to the properties of the oils used in soap production, which affect the saponification rate . The AI value is a crucial parameter for determining soap purity, as noted by high level of impurities in soaps may be attributed to the level of impurities of alkali and oil/fat used for producing the soap.
The analysis presented in Table 4 reveals that a few samples (Mp1, Mp5, and Mp8) show fairly balanced properties, while most others fall short of the ideal standards for AI and FA. Notably, Mp1 emerges as the most compliant soap, boasting suitable levels of AI, FA, and pH. In contrast, Mp3 and Mp10 displays insignificant discrepancies, with elevated AI and FA values and lower TFM, making them less ideal for sensitive cleaning tasks. The consistently high MC levels across all samples highlight a common issue for multipurpose soaps, which could affect their durability. Although hardness varies quite a bit, Mp3 stands out with the highest hardness value, enhancing its durability during use. This aligns with findings from , which report a pH of 7.5 and hardness of 1.3, respectively.
ANOVA results indicate variations among the physicochemical parameters of different soap brands. Medicated soaps lead with the highest mean TFM at 73.04, followed by multipurpose soaps at 68.21, laundry soaps at 65.83, and toilet soaps at 65.22. The P-value of 0.54 suggests that there are no statistically significant differences in TFM among these groups. This supports previous studies that high light the consistency of TFM levels across soap categories to ensure product effectiveness .
When it comes to AI, toilet soaps have the highest mean at 15.35, while medicated soaps come in lower at 9.61. However, the P-value of 0.216 indicates no significant differences among the groups. This finding reflects the industry's approach to formulating soaps to enhance functionality rather than uniformly increasing AI levels . Free Alkaline (FA) levels are highest in medicated soaps at 0.1655 and lowest in toilet soaps at 0.0953. Despite this variability, the P-values (ranging from 0.117 to 0.325) show that FA differences are not statistically significant across soap types. Since excessive FA can irritate the skin, maintaining controlled levels, as observed, is crucial .
Medicated soaps have a mean pH of 7.37, which is more neutral compared to other types that hover around 8.3. The P-value of 0.693 indicates that there are no significant differences among the groups. Keeping the pH close to neutral is really important for compatibility with human skin . When it comes to moisture content(MC), laundry soaps (16.57) and multipurpose soaps (16.23) have higher levels than toilet soaps (9.54) and medicated soaps (5.69). However, the P-values(≥0.469) suggest that these differences aren’t statistically significant, meaning there’s not much variation in MC that affects soap stability. In terms of hardness, laundry soaps are the toughest at 16.75, while medicated soaps are the softest at 4.38. With P-values all at 1.000, the differences in hardness across the groups aren’t statistically significant either. Soap hardness is an important quality factor, but the lack of significant differences here might point to consistent manufacturing practices .
5. Conclusion
The analysis of soap samples reveals variability in key quality parameters, including Total Fatty Matter (TFM), Alcohol Insoluble (AI), Free Alkali (FA), pH, Moisture Content (MC), and Hardness (Hdn).
Abbreviations

TFM

Total Fatty Matter

AI

Alcohol Insoluble

FA

Free Alkali

MC

Moisture Content

Hdn

Hardness

pH

pH

SON

Standard Organisation of Nigeria

WHO

World Health Organisation

Author Contributions
Ibrahim Ladan Garba: Conceptualization, Data curation
Ahmad Mohammad: Supervision
Abdullahi Mohammad: Funding Acquisition
Yusuf Muhammad Bawa: Writing – review & editing
Ibrahim Bako: Writing – original draft
Idris Muhammad: Methodology
Nuraddeen Muhammad Hassan: Formal Analysis, Investigation
Auwalu Yakubu: Methodology
Yasser Muhammad Abdulkarim: Formal Analysis, Investigation
Mohammed Adamu Garga: Writing – review & editing
Lukman Mudi Hamza: Visualization
Conflicts of Interest
All authors declared no conflicts of interest.
References
[1] Ucheanya, F. (2020). Influence of Emotional Appeals in Television Cosmetics Advertisements on Purchase Decisions of Female Students of Higher Institutions in Niger State, Nigeria (Master's thesis, Kwara State University (Nigeria).
[2] Alum, B. N. (2024). Saponification process and soap chemistry. INOSR Appl. Sci, 12, 51-56.
[3] Mohammed, U., F., & Usman, A. (2018). Physicochemical analysis of some soaps produced from five locally processed Nigerian oils, International Journal of Scientific & Engineering Research, 9(12): 531-539.
[4] Zahran, H. (2024). From Fat to Foam: The Fascinating World of Soap Chemistry and Technology. Egyptian Journal of Chemistry, 67(6), 9-17.
[5] Garba, I. L., Uduma, U. A., Sani, S., & Jacob, A. G. (2025). Bacteriological and Mycological Quality Assessments of Selected Soaps Sold in North-West, Nigeria. Sahel Journal of Life Sciences FUDMA, 3(3), 291-300.
[6] Wolfrum, S. (2018). Long chain soaps and alkyl sulfates in aqueous solutions at room temperature (Doctoral dissertation).
[7] Achaw, O. W., & Danso-Boateng, E. (2021). Soaps and detergents. In Chemical and process industries: With examples of industries in Ghana (pp. 1-37). Cham: Springer International Publishing.
[8] Saha, S., & Dutta, P. (2023). Journey from synthetic cleaning agents to green cleaning a gents – review. Mapana Journal of Sciences, 22(3), 25.
[9] Osman, M. A. S. (2024). Study of the preparation of soap prepared from oils different. Humanities & Natural Sciences Journal, 5 (5), 193-207.
[10] Soodoo, N., Deonarine, S., James, S. O., & Narine, S. S. (2025). Towards a Deeper Understanding of Simple Soaps: Influence of Fatty Acid Chain Length on Concentration and Function. Processes, 13(9), 2770.
[11] Nurulain, S., Aziz, N. A., Najib, M. S., Salim, M. R., & Manap, H. (2021, May). A review of free fatty acid determination methods for palm cooking oil. In Journal of Physics: Conference Series (Vol. 1921, No. 1, p. 012055). IOP Publishing.
[12] Mahesar, S. A., Chohan, R., & Sherazi, S. T. H. (2019). Evaluation of physicochemical properties in selected branded soaps. Pakistan Journal of Analytical & Environmental Chemistry, 20(2), 177-183.
[13] Shehu, A., Okunola, O. J., & Uduma, U. A. (2025). Development and Characterization of Nano-Enhanced Soap with Enhanced Physicochemical and Antimicrobial Properties. Fudma Journal Of Sciences, 9(1), 196-204.
[14] Soni, K. (2025). Biodiesel Production From Waste Cooking Oil: A Comparative Analysis of Domestic and Cultural Waste, and Saponification of Crude Glycerin (Master's thesis, Maharshi Dayanand University (India)).
[15] Ogunsuyi H., O., & Akinnawo, C., A. (2012). Quality assessment of soaps produced from palm bunch ash-derived alkali and coconut oil. Journal of Applied Sciences & Environmental Management 16(4): 363-366.
[16] Vivian, O. P., Nathan, O., Osano, A., Mesopirr, L. & Omwoyo, W. N. (2014). Assessment of the physicochemical properties of selected commercial soaps manufactured and sold in Kenya. Open Journal of Applied Sciences, 4: 433-440.
[17] Habib, A., Kumar, S., Sorowar, S., Karmoker, J., Khatun, M. K. & Al-Reza, S. M. (2016) Study on the physicochemical properties of some commercial soaps available in Bangladeshi Market. International Journal of Advanced Research in Chemical Science, 9-12.
[18] Betsy, K. J., Jilu, M., Fathima, R. & Varkey, J. T. (2013) Determination of alkali content & total fatty matter in cleansing agents. Asian Journal of Science and Applied Technology, 2: 8-12.
[19] Abulude, F., Fagbayide, S. D., Olubayode, S. A. & Adeoya, E. A. (2017) Assessment of physicochemical properties of soaps, detergents and water samples originated from Nigeria. Continental Journal of Sustainable Development, 8: 55-67.
[20] Popescu, V., Soceanu, A., Dobrinas, S., Stanciu, G. & Epure, D. T. (2011) Quality control and evaluation of certain properties for soaps Made in Romania. Scientific Study & Research: Chemistry & Chemical Engineering, Biotechnology, Food Industry, 12: 257-2.
[21] Idoko, O., Emmanuel, S. A., Salau, A. A. & Obigwa, P. A. (2018) Quality assessment on some soaps sold in Nigeria. Nigerian Journal of Technology, 37: 1137.
[22] Isah, A., N., Asli, U., A. Audu, N., Bello, S., I., Waziri, J., & Salihu, S., O. (2021). Laundry soap production from the respective tallows of goat, sheep and cow: Evaluation of physicochemical properties for the best. International Research Journal of Pure and Applied Chemistry, 22(3): 22-33.
[23] Standards Organisation of Nigeria (SON). (2011). Quality Standards for Multipurpose Soaps. Retrieved from [SON web site or publication].
[24] The Royal Society of Chemistry, (2017). Synthesis and properties of soap, available online at:
[25] Tewarik. S. A (2004). Text book of Chemistry. 3rd Edition Vikas publishing House PVT Ltd. 26, 594600.
[26] Ahmed, R., & Khan, T. (2018). Physicochemical characteristics of commercial soaps: A comparative study. Journal of Cosmetic Science, 69(3), 115-124.
[27] Patel, S., Gupta, P., Sharma, A., & Verma, R. (2020). Formulation Considerations for Soaps: A Review. International Journal of Industrial Chemistry, 42(2), 345-360.
[28] WHO. (2022). Standards and Guidelines for the Composition of Soap Products. World Health Organization Reports. Pg 286-296.
[29] Smith, J., & Jones, M. (2019). pH levels in personal care products: Implications for skin health. Dermato Cosmetic Journal, 28(5), 203-212.
[30] Taylor, B., Johnson, E., Martinez, C., & Singh, A. (2021). Impact of hardness on soap quality and consumer preferences. Materials in Chemistry, 37(4), 450-462.
Cite This Article
  • APA Style

    Garba, I. L., Mohammad, A., Mohammad, A., Bawa, Y. M., Garga, M. A., et al. (2026). Physicochemical Quality Evaluation of Commercial Soaps Marketed in North Western Nigeria. American Journal of Applied Chemistry, 14(6), 109-120. https://doi.org/10.11648/j.ajac.20261406.11

    Copy | Download

    ACS Style

    Garba, I. L.; Mohammad, A.; Mohammad, A.; Bawa, Y. M.; Garga, M. A., et al. Physicochemical Quality Evaluation of Commercial Soaps Marketed in North Western Nigeria. Am. J. Appl. Chem. 2026, 14(6), 109-120. doi: 10.11648/j.ajac.20261406.11

    Copy | Download

    AMA Style

    Garba IL, Mohammad A, Mohammad A, Bawa YM, Garga MA, et al. Physicochemical Quality Evaluation of Commercial Soaps Marketed in North Western Nigeria. Am J Appl Chem. 2026;14(6):109-120. doi: 10.11648/j.ajac.20261406.11

    Copy | Download

  • @article{10.11648/j.ajac.20261406.11,
      author = {Ibrahim Ladan Garba and Ahmad Mohammad and Abdullahi Mohammad and Yusuf Muhammad Bawa and Mohammed Adamu Garga and Ibrahim Bako and Idris Muhammad and Nuraddeen Muhammad Hassan and Auwalu Yakubu and Yasser Muhammad Abdulkarim and Lukman Mudi Hamza},
      title = {Physicochemical Quality Evaluation of Commercial Soaps Marketed in North Western Nigeria},
      journal = {American Journal of Applied Chemistry},
      volume = {14},
      number = {6},
      pages = {109-120},
      doi = {10.11648/j.ajac.20261406.11},
      url = {https://doi.org/10.11648/j.ajac.20261406.11},
      eprint = {https://article.sciencepublishinggroup.com/pdf/10.11648.j.ajac.20261406.11},
      abstract = {This research evaluated the physicochemical properties of selected commercial soaps sourced from prominent markets in north-western Nigeria. A total of forty soap samples including toilet, laundry, medicated, and multipurpose soaps, were randomly acquired from central markets located in Katsina State, Kano State, Kaduna State, and Jigawa State. The samples were transported to the laboratory, grated and underwent physicochemical analysis following standard analytical methods. The parameters assessed included total fatty matter(TFM), alcohol insoluble matter(AI), free alkali(FA), pH, moisture content(MC), and hardness(Hdn). Total fatty matter values were found to range from 54.13% to75.36% in toilet soaps, 45.38% to76.09% in laundry soaps, 68.32% to 78.55% in medicated soaps, and 58.46% to 76.09% in multipurpose soaps. Several samples met or surpassed the recommended limits set by the Standards Organisation of Nigeria. However, some products displayed high levels of alcohol insoluble matter and free alkali, which could potentially impact product quality and skin compatibility. The pH values varied from 6.45 to 9.58, indicating a range from mildly acidic to strongly alkaline, with several samples exceeding the recommended pH range for skin-friendly soaps. Moisture content and hardness also exhibited significant variation among the samples analyzed. Analysis of variance (ANOVA) revealed no significant differences (p>0.05) among the soap categories concerning the measured physicochemical parameters. Correlation analysis demonstrated a strong negative correlation between TFM and AI (r=−0.619, p<0.01), indicating that higher fatty matter content was associated with lower levels of insoluble materials. Additionally, moisture content showed a very strong positive correlation with hardness (r=0.947, p<0.01), while moderate positive correlations were noted between pH and other parameters.},
     year = {2026}
    }
    

    Copy | Download

  • TY  - JOUR
    T1  - Physicochemical Quality Evaluation of Commercial Soaps Marketed in North Western Nigeria
    AU  - Ibrahim Ladan Garba
    AU  - Ahmad Mohammad
    AU  - Abdullahi Mohammad
    AU  - Yusuf Muhammad Bawa
    AU  - Mohammed Adamu Garga
    AU  - Ibrahim Bako
    AU  - Idris Muhammad
    AU  - Nuraddeen Muhammad Hassan
    AU  - Auwalu Yakubu
    AU  - Yasser Muhammad Abdulkarim
    AU  - Lukman Mudi Hamza
    Y1  - 2026/11/16
    PY  - 2026
    N1  - https://doi.org/10.11648/j.ajac.20261406.11
    DO  - 10.11648/j.ajac.20261406.11
    T2  - American Journal of Applied Chemistry
    JF  - American Journal of Applied Chemistry
    JO  - American Journal of Applied Chemistry
    SP  - 109
    EP  - 120
    PB  - Science Publishing Group
    SN  - 2330-8745
    UR  - https://doi.org/10.11648/j.ajac.20261406.11
    AB  - This research evaluated the physicochemical properties of selected commercial soaps sourced from prominent markets in north-western Nigeria. A total of forty soap samples including toilet, laundry, medicated, and multipurpose soaps, were randomly acquired from central markets located in Katsina State, Kano State, Kaduna State, and Jigawa State. The samples were transported to the laboratory, grated and underwent physicochemical analysis following standard analytical methods. The parameters assessed included total fatty matter(TFM), alcohol insoluble matter(AI), free alkali(FA), pH, moisture content(MC), and hardness(Hdn). Total fatty matter values were found to range from 54.13% to75.36% in toilet soaps, 45.38% to76.09% in laundry soaps, 68.32% to 78.55% in medicated soaps, and 58.46% to 76.09% in multipurpose soaps. Several samples met or surpassed the recommended limits set by the Standards Organisation of Nigeria. However, some products displayed high levels of alcohol insoluble matter and free alkali, which could potentially impact product quality and skin compatibility. The pH values varied from 6.45 to 9.58, indicating a range from mildly acidic to strongly alkaline, with several samples exceeding the recommended pH range for skin-friendly soaps. Moisture content and hardness also exhibited significant variation among the samples analyzed. Analysis of variance (ANOVA) revealed no significant differences (p>0.05) among the soap categories concerning the measured physicochemical parameters. Correlation analysis demonstrated a strong negative correlation between TFM and AI (r=−0.619, p<0.01), indicating that higher fatty matter content was associated with lower levels of insoluble materials. Additionally, moisture content showed a very strong positive correlation with hardness (r=0.947, p<0.01), while moderate positive correlations were noted between pH and other parameters.
    VL  - 14
    IS  - 6
    ER  - 

    Copy | Download

Author Information
  • Bioresources Development Centre Katsina, National Biotechnology Research and Development Agency, Abuja, Nigeria;Department of Chemistry, Federal University Dutsin-Ma Katsina, Dutsin-Ma, Nigeria

  • Bioresources Development Centre Katsina, National Biotechnology Research and Development Agency, Abuja, Nigeria

  • Bioresources Development Centre Makurdi, National Biotechnology Research and Development Agency, Abuja, Nigeria

  • Bioresources Development Centre Katsina, National Biotechnology Research and Development Agency, Abuja, Nigeria

  • Bioresources Development Centre Katsina, National Biotechnology Research and Development Agency, Abuja, Nigeria

  • Bioresources Development Centre Katsina, National Biotechnology Research and Development Agency, Abuja, Nigeria

  • Bioresources Development Centre Katsina, National Biotechnology Research and Development Agency, Abuja, Nigeria

  • Bioresources Development Centre Katsina, National Biotechnology Research and Development Agency, Abuja, Nigeria

  • Bioresources Development Centre Katsina, National Biotechnology Research and Development Agency, Abuja, Nigeria

  • Bioresources Development Centre Katsina, National Biotechnology Research and Development Agency, Abuja, Nigeria

  • Bioresources Development Centre Katsina, National Biotechnology Research and Development Agency, Abuja, Nigeria